
A fix-and-flip offer should come from a complete project model, not from the asking price or a single percentage rule. Estimate the finished value, define the work required to reach it, account for every cost between acquisition and sale, and then solve for the highest purchase price that still meets your required result. Treat unsupported assumptions as risks rather than facts.
This article uses a hypothetical property to demonstrate the method. The numbers are teaching inputs, not market observations or Faundare Capital loan terms.
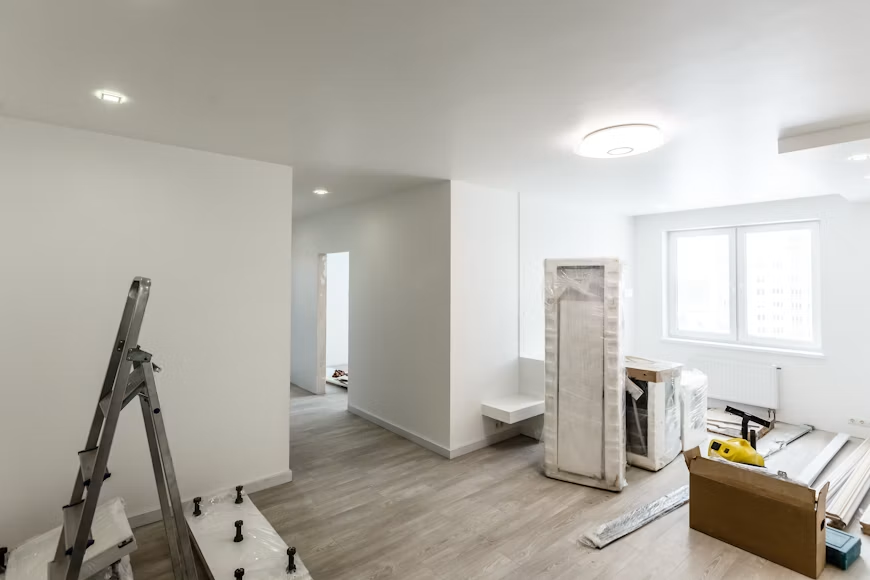
First, understand how a fix-and-flip project makes money
A fix-and-flip investor buys a property, completes work intended to improve its condition and marketability, and usually sells it after renovation. The project makes money only if the sale proceeds exceed the purchase price and every cost required to acquire, renovate, finance, hold and sell the property. A large difference between purchase price and expected resale value can therefore coexist with a weak or negative result.
The analysis begins with the proposed finished property because its supportable after-repair value (ARV) limits the revenue available to cover those costs. The investor then works backward to a purchase ceiling. Financing changes when cash is required and how much interest and fees the project bears; it does not create profit or cure an unsupported value or construction assumption.
This article follows that sequence: support the finished value, define the renovation, build the full project cost, test downside cases and then decide whether the price, expected return and required liquidity work together.
Start with the finished property
After-repair value (ARV) is an opinion of the property's likely market value after the planned work is complete. It depends on the finished property's location, size, condition, layout and features—not simply on the highest nearby sale.
Select comparable sales that resemble the property you intend to create. Record the sale date, distance, living area, bed and bath count, lot, condition and material differences. A broad house-price index can describe movement in an area, but it does not value an individual property.2 If the comparison requires large or speculative adjustments, use a range and carry that uncertainty into the offer decision.
For the hypothetical project, three adjusted comparisons support an ARV range of $325,000 to $345,000. The base case uses $340,000. The lower end remains visible because the project must still be evaluated if the optimistic comparison proves unrepresentative.
Translate condition into a scope before pricing it
A repair allowance per square foot can screen opportunities, but it cannot substitute for a scope. Walk the property with an appropriate contractor or specialist when access permits. Record each observed condition, the proposed remedy, quantity, finish level, responsible trade and evidence behind the estimate.
Separate four types of information:
| Status | Meaning | Example |
|---|---|---|
| Documented | Direct evidence establishes the condition or obligation | Inspection photograph and contractor bid identify roof replacement |
| Supported | Multiple relevant observations support the estimate | Comparable finished homes consistently use similar flooring and fixtures |
| Estimated | A reasoned amount is necessary but not yet confirmed | Allowance for electrical corrections pending panel inspection |
| Missing | The answer could materially change the project | Sewer condition unknown because no scope was performed |
This hypothetical scope totals $62,000 before contingency. It includes roof and mechanical work, electrical and plumbing corrections, kitchen and bathroom improvements, flooring, paint, exterior work, permits, waste and final cleaning. A separate $7,500 construction contingency addresses identified uncertainty; it is not a budget for optional upgrades.
Properties built before 1978 can trigger federal lead-safe renovation requirements. EPA states that its Renovation, Repair and Painting rule can apply when a house is bought, renovated and sold for profit, while some states administer their own programs.3 Verify the applicable federal, state and local requirements before finalizing scope or contractor selection.
Count the entire project, not only purchase and repairs
The spread between purchase price and ARV must absorb acquisition, construction, financing, time and disposition costs.
| Model component | Base assumption |
|---|---|
| Proposed purchase price | $151,000 |
| Acquisition closing and diligence | $5,000 |
| Renovation scope | $62,000 |
| Renovation contingency | $7,500 |
| Financing fees | $5,000 |
| Interest during project | $16,000 |
| Taxes, insurance, utilities and maintenance | $9,600 |
| Selling and sale-closing costs | $27,200 |
| Illustrative required project profit | $56,700 |
| Required ARV | $340,000 |
Selling and sale-closing costs equal 8% of the $340,000 ARV in this teaching model. The percentage is an input, not a market benchmark; a real model should separate brokerage, transfer, title, legal, staging and seller-concession assumptions where they apply.
There is no authoritative profit margin that makes every flip acceptable. This example uses an illustrative 20% return hurdle on total project cost to demonstrate how a selected return requirement affects price. It is an underwriting policy for the example, not a market average or a Faundare Capital requirement.
Here, total project cost means the purchase price plus acquisition and diligence costs, renovation, renovation contingency, financing fees, project interest, property taxes, insurance, utilities, maintenance, and selling and sale-closing costs. It excludes the required profit itself, unspent liquidity reserves and the investor's income taxes. A reserve affects cash required but is not a project expense unless it is spent.
With $132,300 of modeled costs other than the purchase price, the 20% hurdle is solved simultaneously with the purchase ceiling rather than added as an arbitrary dollar amount:
Purchase ceiling = ($340,000 ÷ 1.20) − $132,300 = approximately $151,000
Illustrative profit = $340,000 − $151,000 − $132,300 = $56,700, or approximately 20% of $283,300 total project cost
The maximum purchase price is the amount left after subtracting every other required use from the supportable ARV:
Maximum purchase price = ARV − acquisition costs − renovation − contingency − financing fees − interest − carrying costs − selling costs − required profit
For this example:
$340,000 − $5,000 − $62,000 − $7,500 − $5,000 − $16,000 − $9,600 − $27,200 − $56,700 = $151,000
This is an analytical ceiling under the selected assumptions, not a recommended offer. Title issues, property condition, competitive bidding, financing approval and contract terms can change the decision. If the seller requires $185,000, the gap should not be hidden by raising ARV, reducing contingency or lowering the return hurdle without a reasoned decision.
Profit and cash required answer different questions
Estimated profit measures the modeled economic result. Cash required measures when the investor must supply money. A loan may fund part of the acquisition and approved renovation costs, but timing matters: deposits, completed work and carrying costs may be paid before a draw is reimbursed.
Assume solely for illustration that a proposed loan funds 80% of the purchase price and reimburses $62,000 of eligible renovation costs after verification. The modeled loan commitment is:
($151,000 × 80%) + $62,000 = $182,800
Renovation lenders may apply more than one leverage test. A cost-based calculation can determine how much of the purchase and eligible renovation budget may be financed, while a loan-to-ARV limit caps the total committed loan against the independently supported completed value:
Loan-to-ARV = total committed loan ÷ supported ARV
The applicable loan amount is generally constrained by the most restrictive test, along with loan-size, borrower, property and program requirements. In this example, the modeled $182,800 commitment equals 53.8% of the $340,000 ARV. Faundare Capital's current Fix & Flip/Hold program terms describe total financing of up to 75% of supported ARV, subject to underwriting and program availability. At that stated ceiling, the cost-based $182,800 calculation remains the binding limit in this example because 75% of $340,000 is $255,000. A lower approved ARV, lower applicable ARV limit or other underwriting adjustment could reduce the loan and increase the investor's required cash.
The companion renovation schedule for this same example reaches a peak of $19,000 of work paid but not yet reimbursed. If the investor also maintains a liquidity reserve equal to 10% of the modeled loan commitment, the cash requirement is:
- $30,200 for the unfunded purchase portion;
- $5,000 for acquisition and diligence;
- $5,000 in financing fees;
- $7,500 as the cash-funded renovation contingency;
- $19,000 for completed work awaiting draw reimbursement; and
- $18,280 as a liquidity reserve, equal to 10% of the $182,800 modeled loan amount.
That produces approximately $84,980 of initial, draw-period and reserve cash exposure, even though the eligible renovation costs are included in the modeled loan commitment. This is a cash-planning estimate, not an assertion that a lender will require or hold that exact amount. Adding the modeled $16,000 of interest and $9,600 of non-interest carrying costs produces $110,580 of cash needed through the modeled sale. Actual eligibility, advance rates, draw timing, reserves and documentation depend on the approved loan. Open these assumptions in the Fix & Flip calculator, or download this example (CSV).
Test the assumptions that can erase the margin
One favorable case does not establish resilience. Scenario analysis shows how the result changes when important assumptions move together.
| Scenario | Change from base | Estimated profit |
|---|---|---|
| Base | $340,000 ARV; $62,000 scope; planned hold | $56,700 |
| Lower sale value | ARV falls 5% to $323,000 | $39,700 |
| Higher renovation cost | Scope rises 15% to $71,300 | $47,400 |
| Longer execution | Three additional months add $6,000 | $50,700 |
| Combined downside | Lower ARV, higher scope and longer hold | $24,400 |
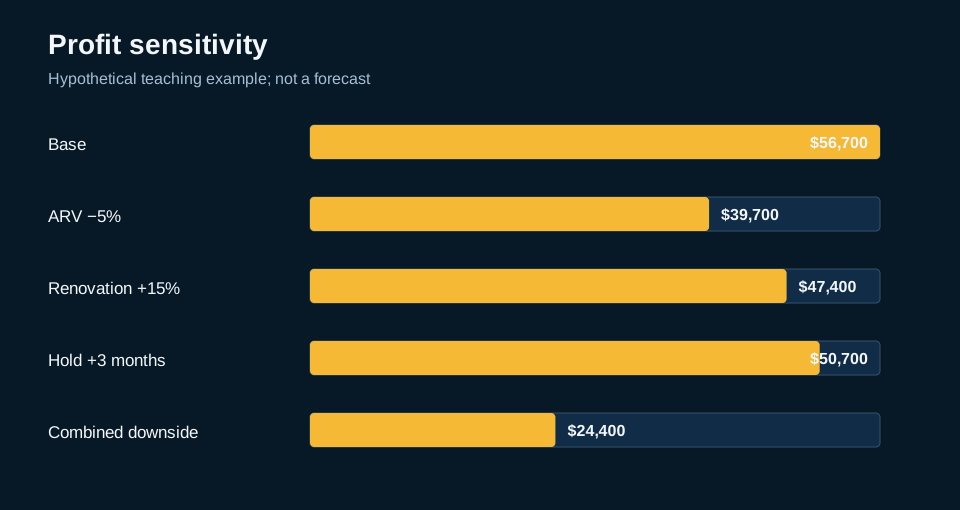
The combined case does not predict the outcome. It shows that the 20% base-case hurdle falls to approximately 8.2% on the higher downside project cost when sale value, renovation cost and duration move against the plan. The investor must decide whether $24,400 adequately compensates for the unresolved condition, execution and sale risk; the original percentage target does not answer that question by itself.
Set the profit hurdle, purchase ceiling and go/no-go test
There is no published industry standard that makes 20% or 25% the ideal net return for every flip. Those percentages may be used as investor-selected screening hurdles, but their suitability depends on project duration, uncertainty, concentration, taxes and alternative uses of capital. The article therefore uses 20% only as an illustrative policy and tests the consequence of choosing a lower or higher hurdle.
ATTOM reported a 21.5% typical gross return on the original purchase price for homes flipped in the second quarter of 2026, but its measure subtracts only the original purchase price from resale proceeds and excludes renovation and other project expenses.4 It is not comparable with net return on total project cost and should not be used as the return target in this model.
| Selected net-return hurdle on total project cost | Approximate purchase ceiling | Approximate project cost | Required profit |
|---|---|---|---|
| 15% | $163,350 | $295,650 | $44,350 |
| 20% — teaching case | $151,000 | $283,300 | $56,700 |
| 25% | $139,700 | $272,000 | $68,000 |
This table does not recommend one hurdle. It shows the tradeoff: requiring a higher return reduces the price the investor can pay when ARV and other costs remain unchanged.
Set the required profit before solving for price. Express it in at least two ways—absolute dollars and a rate on project cost or invested cash—because a percentage can conceal whether the dollar result compensates for the work and risk. Then test whether the required profit still leaves an acceptable result when value, scope or time moves against the plan.
For this example, the purchase ceiling is approximately $151,000 because that is the price consistent with the $340,000 supportable ARV, $132,300 of non-purchase project costs and the selected 20% return on total project cost. Paying more lowers the modeled return unless another assumption improves with credible new evidence.
A prospective deal is supportable only when the evidence and the economics agree:
| Decision test | What should be true before proceeding |
|---|---|
| Finished value | Multiple relevant closed sales support the ARV range without speculative adjustments |
| Scope and cost | Material work is documented; allowances and contingency reflect unresolved conditions |
| Required return | Base-case profit clears the investor's dollar and percentage hurdles after all modeled costs |
| Downside resilience | A plausible combined downside leaves an acceptable result rather than erasing the margin |
| Liquidity | Available cash covers purchase equity, closing costs, draw timing and the chosen reserve |
| Financing leverage | The total loan satisfies the applicable acquisition, cost and loan-to-ARV limits; the investor can fund any resulting gap |
| Execution and exit | The schedule, contractor capacity, financing terms and sale or hold plan are credible |
Before submitting an offer, the analysis should answer five questions:
- Which closed sales support the finished-property range, and which differences remain judgmental?
- Which work is documented, and which allowances depend on further access or specialist review?
- Does the model include financing, carrying and selling costs for a realistic duration?
- How much cash is required before reimbursements and sale proceeds arrive?
- Which change in value, cost or time would make the result unacceptable?
The output may be an offer at or below the calculated ceiling, a contract with appropriate investigation rights, a request for more evidence, or a decision to stop. The purpose of the model is to make those choices visible before the investor becomes committed to optimistic assumptions.
References
1. Getty Images for Unsplash+. Home renovation in room full of painting tools. https://unsplash.com/photos/home-renovation-in-room-full-of-painting-tools-YcKl6DZ5WsU. Licensed to Faundare Capital LLC under the Unsplash+ License. Accessed September 20, 2026.
2. Federal Housing Finance Agency. Experimental Datasets for Local House Price Indices—Frequently Asked Questions. September 2024. https://www.fhfa.gov/sites/default/files/2024-09/bdl_faqs_local_hpis.pdf. Accessed September 29, 2026.
3. U.S. Environmental Protection Agency. Lead Renovation, Repair and Painting Program. Updated 2026. https://www.epa.gov/lead/lead-renovation-repair-and-painting-program. Accessed September 29, 2026.
4. ATTOM. Home Flipping Profits Continue Gradual Two-Year Decline. October 1, 2026. https://www.attomdata.com/news/market-trends/flipping/home-flipping-profits-continue-gradual-two-year-decline/. Accessed October 1, 2026.