
The lowest quoted interest rate does not necessarily produce the lowest cost, the most usable proceeds or the best fit for a property plan. Compare proposals on the same requested transaction, normalize when cash is advanced and repaid, and model the expected exit date. Then review the conditions that could change the quoted economics.
The proposals below are hypothetical teaching documents. They are not current offers, commitments or Faundare Capital program terms.

First, understand what a loan proposal represents
A loan proposal or term sheet summarizes the structure a lender is prepared to consider for a stated transaction. It usually identifies proposed proceeds, pricing, term, collateral and key conditions, but it is not the final loan agreement and may not be a binding commitment. Underwriting, appraisal, due diligence and documentation can change or eliminate the proposed terms.
For the investor, a proposal answers more than “What is the rate?” It allocates project costs between lender and borrower, determines when proceeds become available, sets obligations during the loan and defines what happens if the project repays early or runs late. Two proposals can quote similar loan amounts while creating materially different cash requirements and exit risks.
A useful comparison therefore begins with the same property plan and follows the money from closing through repayment.
Confirm that the proposals solve the same financing problem
Before comparing price, confirm that each proposal assumes the same purchase price, renovation budget, property value, business plan and requested closing date. A smaller loan with a lower rate may require materially more cash. A larger commitment may include renovation proceeds that arrive only after completed work is verified.
The example property has a $250,000 purchase price, $80,000 renovation budget and $400,000 supportable after-repair value (ARV). Base acquisition and renovation uses therefore total $330,000 before closing, financing, carrying and sale costs.
| Term | Proposal A | Proposal B |
|---|---|---|
| Acquisition advance | $200,000 | $212,500 |
| Renovation commitment | $80,000 | $68,000 |
| Maximum commitment | $280,000 | $280,500 |
| Quoted annual rate | 11.50% | 10.75% |
| Origination fee | 2.00% of commitment | 3.00% of commitment |
| Initial term | 12 months | 9 months |
| Minimum interest | 3 months | 6 months |
| Extension | One 3-month option; 1.00% fee, subject to conditions | One 3-month option; 1.00% fee, subject to conditions |
| Interest basis in example | Outstanding balance | Full commitment |
| Commitment / purchase + renovation cost | 84.8% | 85.0% |
| Commitment / $400,000 ARV | 70.0% | 70.1% |
Proposal B supplies $12,500 more toward the purchase but $12,000 less toward renovation. Its headline rate is lower, while its fee and assumed interest basis are less favorable. Both commitments are near 85% loan-to-cost (LTC) and 70% loan-to-ARV. The latter is a loan-to-value (LTV) comparison using the supported completed value. Those ratios do not establish final proceeds; appraisal, eligibility, borrower and program tests may reduce the amount. The signed documents and lender explanation—not this table—must determine how interest and fees actually accrue.
Compare cash required, not only loan amount
At closing, Proposal A leaves $50,000 of purchase price unfunded; Proposal B leaves $37,500. If origination is paid in cash, the initial comparison is:
| Closing use | Proposal A | Proposal B |
|---|---|---|
| Purchase equity | $50,000 | $37,500 |
| Origination fee | $5,600 | $8,415 |
| Subtotal before other closing items | $55,600 | $45,915 |
Proposal B needs $9,685 less at closing in this simplified comparison. It also leaves $12,000 more renovation cost outside the commitment, so the apparent advantage can disappear during construction. Add lender deposits, third-party reports, title and legal costs, reserves and every ineligible use before deciding which proposal preserves more liquidity.
The same comparison through completion shows the shift:
| Base project cash use | Proposal A | Proposal B |
|---|---|---|
| Purchase equity | $50,000 | $37,500 |
| Renovation outside commitment | $0 | $12,000 |
| Origination fee | $5,600 | $8,415 |
| Base cash before other costs and draw timing | $55,600 | $57,915 |
Proposal B’s closing requirement is lower, but its base purchase, renovation and origination contribution is $2,315 higher. Neither total includes cash temporarily required while renovation draws await reimbursement. A proposal can improve closing liquidity while increasing total project cash.
Model interest using the stated advance mechanics
Assume Proposal A’s acquisition balance of $200,000 is outstanding during the first month and $20,000 renovation draws increase the balance at the beginning of months two through five. The six modeled monthly balances are $200,000, $220,000, $240,000, $260,000, $280,000 and $280,000. Their average is approximately $246,667. Illustrative interest is:
$246,667 × 11.50% × 6 ÷ 12 = $14,183
Assume Proposal B charges the stated rate on the full $280,500 commitment for the same six months:
$280,500 × 10.75% × 6 ÷ 12 = $15,077
Under those assumptions, the proposal with the lower rate produces more interest during the six-month hold. The conclusion changes if Proposal B charges only on advanced funds or Proposal A’s draw timing differs. Ask each lender to confirm the balance and day-count method in writing.
Minimum-interest provisions require a separate test. If Proposal B is repaid after four months but requires six months of interest, the cost model should still include six months. Do not add minimum interest to modeled interest as a second charge; replace the shorter calculated period with the applicable minimum unless the documents state another method.
Compare more than one exit date
An investor expecting a six-month project should still evaluate delay and prepayment provisions.
| Modeled cost | Proposal A: 6 months | Proposal B: 6 months | Proposal A: 12 months | Proposal B: 12 months* |
|---|---|---|---|---|
| Origination fee | $5,600 | $8,415 | $5,600 | $8,415 |
| Illustrative interest | $14,183 | $15,077 | $30,283 | $30,154 |
| Extension fee | — | — | — | $2,805 |
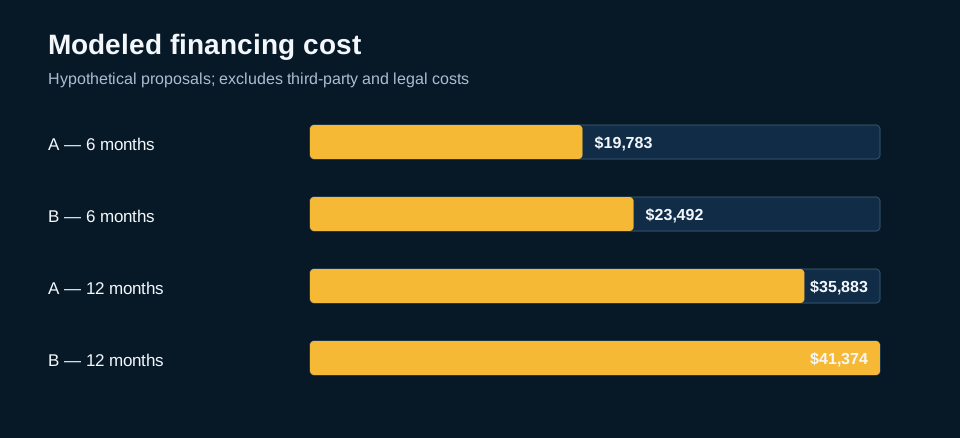
| Modeled financing cost | $19,783 | $23,492 | $35,883 | $41,374 |
*Proposal B requires an extension to reach 12 months under the hypothetical terms. Interest estimates use simplified balances and exclude legal, servicing, draw, appraisal and other transaction costs.
Proposal A is less expensive in both illustrated periods despite its higher rate. Proposal B still provides more acquisition proceeds at closing, which may matter more to an investor whose constraint is initial liquidity. The comparison identifies the tradeoff; it does not select the loan without considering the business plan and remaining conditions.
For the six-month case, modeled financing cost equals approximately 7.1% of Proposal A’s commitment and 8.4% of Proposal B’s commitment. Those percentages are simple cost-to-commitment comparisons for the illustrated hold, not annual percentage rates or investment returns:
- Proposal A: $19,783 ÷ $280,000 = 7.1%
- Proposal B: $23,492 ÷ $280,500 = 8.4%
The denominator should be changed to actual usable proceeds if part of a commitment is unavailable, conditional or unlikely to be drawn.
Read the terms that can alter the modeled result
Create a conditions register beside the numerical comparison, including any recourse or guarantee obligation.
| Provision | Question to resolve | Why it matters |
|---|---|---|
| Maximum proceeds | Which value, cost or coverage test controls the final amount? | Appraisal or underwriting changes can reduce proceeds |
| Renovation draws | What is eligible, when can a request be made and what must be verified? | Timing changes borrower cash exposure |
| Interest calculation | Commitment or outstanding balance; actual/360 or another convention? | The same quoted rate can produce different cost |
| Extension | Is it automatic, conditional or subject to new underwriting? | A modeled fallback may not be available |
| Prepayment or minimum interest | What is owed if the property sells or refinances early? | Short holds may not avoid the expected interest cost |
| Reserves | Who controls them and when can unused funds be released? | Restricted cash is not available liquidity |
| Recourse and guarantees | What obligations survive a property-level shortfall? | Economic exposure extends beyond payment amount |
| Third-party reports and deposits | Which amounts are refundable, credited or spent? | Cash can be committed before final approval |
A term sheet generally summarizes proposed economics and conditions; it should not be treated automatically as final approval or the complete legal agreement. The OCC describes commercial real-estate lending as involving property, borrower, repayment and documentation analysis, with structures varying by transaction.2 Have qualified counsel review legal obligations where appropriate.
The FDIC’s commercial-real-estate loan-review procedures separately identify final signed commitment letters, settlement statements, operating statements, rent rolls, leases and other documents in a complete credit file.3 That distinction reinforces why a proposal summary should be reconciled to the final closing package rather than archived as if its preliminary terms necessarily survived underwriting.
Build a proposal-normalization worksheet
Use one row for each economic or legal feature and preserve the source location from each proposal. The comparison should calculate rather than manually type:
- acquisition proceeds available at closing;
- renovation or future-funding commitment;
- permanent and temporary borrower cash;
- fees calculated on commitment, funded amount or another base;
- interest by month under the documented balance and day-count method;
- minimum-interest and prepayment amounts;
- extension fees and extended-period interest;
- maturity payoff and any exit fees; and
- costs that remain unknown or conditional.
Mark unresolved terms as unresolved. A zero placed where the proposal is silent makes the missing charge look confirmed. If the answer could change the ranking, request clarification before selecting the loan.
Decide by matching the loan to the plan
A defensible comparison answers:
- How much usable money arrives at closing and through later draws?
- How much cash must the borrower contribute, and when?
- What is the financing cost at the expected exit and a delayed exit?
- Which terms restrict sale, refinance, construction or cash management?
- Which items remain estimates, conditions or subject to approval?
The best-fitting proposal is the one whose proceeds, timing, obligations and exit provisions work with a supportable property plan. Rate is one input in that decision.
Reject the numerical ranking and investigate further when:
- the proposals use different property values, costs or closing dates;
- the quoted commitment includes proceeds that are not available for the intended uses;
- draw timing would exceed the borrower’s available liquidity;
- the expected exit occurs after maturity without a clearly available extension;
- key fees, minimum interest or repayment provisions remain undefined; or
- the business plan only works under the most favorable underwriting assumption.
References
1. Berke Citak. A desk with a calculator, papers, eyeglasses and office supplies. https://unsplash.com/photos/a-desk-with-a-calculator-papers-eyeglasses-and-office-supplies-QV5VoI18Ld8. Unsplash. Used under the Unsplash License. Accessed October 3, 2026.
2. Office of the Comptroller of the Currency. Comptroller’s Handbook: Commercial Real Estate Lending, Version 2.0. March 2022; reputation-risk references revised March 20, 2025. https://www.occ.treas.gov/publications-and-resources/publications/comptrollers-handbook/files/commercial-real-estate-lending/pub-ch-commercial-real-estate.pdf. Accessed September 29, 2026.
3. Federal Deposit Insurance Corporation. Risk Management Manual of Examination Policies: Commercial Real Estate Lending—Commercial Real Estate Loan Review. May 2024. https://www.fdic.gov/risk-management-manual-examination-policies/commercial-real-estate-lending. Accessed October 1, 2026.
Figure and table provenance. The proposal terms, calculations and analytical graphic in this guide were created by Faundare Capital for a hypothetical teaching example. The opening photograph is cited in the references. The regulatory references support the review method; they do not supply or endorse the fictional terms.